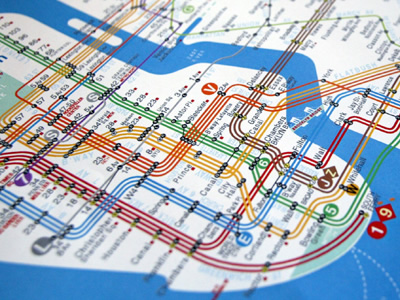
NYC Subway Traffic Analysis

Team:
Don Perkus, John Winter, Michael Zhang, and myself (Sean Osier)
Situation:
- WomenTechWomenYes International (WTWY), a hypothetical client, is a non-profit that aims to increase the participation of women in technology.
- WTWY uses "street teams" at entrances to subway stations as a significant portion of their fundraising efforts.
- WTWY engaged us to optimize the effectiveness of their street teams.
Recommendations:
- Optimal timing: Weekday evenings
- Optimal locations: Factoring in pure subway traffic volume, proximity to nearby tech startups (and specifically startups founded by or focused on women), and relative neighborhood affluence, our top stations:
- 34th and Herald Square
- 42nd and Time Square
- 34th and Penn Station
- 42nd and Grand Central
- 59th and Columbus
- 34th and Herald Square
Report:
Data:
- NYC MTA Turnstile Data
- Tech Startups Heatmap
- Women Tech Startups
- Average Income by Manhattan ZIP code
Technologies:
- Python
- Pandas
- UNIX
- Github
- MATLAB
- Google Fusion Tables
- Excel
- Powerpoint
Methodolgy:
- Scrape, clean, and roll up MTA turnstile data to the station level
- Aggregate data over all stations, and determine optimal days of the week for street team deployment
- Looking at just target days of the week, determine optimal time of day
- Looking at just optimal time and days of week, determine top stations by volume and plot on map
- Layer in the density of tech startups and plot
- Layer in neighborhood affluence (average income) and plot
- Determine a final "score" for each station by combining the three factors (pure station traffic volume, density of tech startups, and neighborhood affuence) using a weight for each based its relative importance
- Rank the stations by overall "score"
Code:
For more details checkout my Github repository.
Written on September 28, 2015